关于这张照片
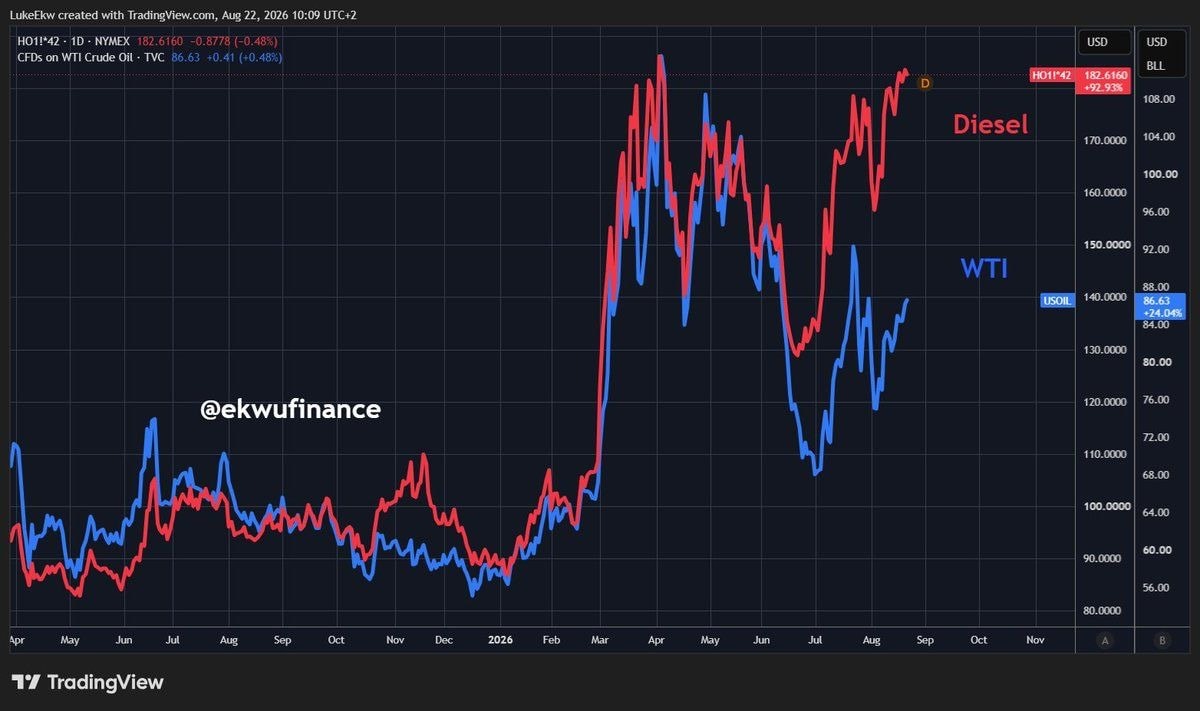
The image is a financial chart displaying the price movements of Diesel and WTI crude oil over time. The chart has a dark background with a grid overlay and shows two distinct lines, one red for Diesel and one blue for WTI. Text overlays indicate the names of the commodities and their current values. The overall mood is analytical and informative, typical of financial data presentation. A prominent watermark reads "@ekwufinance" and "17 TradingView" is visible at the bottom. ON-SCREEN TEXT: LukeEkw created with TradingView.com, Aug 22, 2026 10:09 UTC+2 HO11*42 - 1D - NYMEX 182.6160 -0.8778 (-0.48%) CFDs on WTI Crude Oil - TVC 86.63 +0.41 (+0.48%) D Diesel WTI USOIL 140.0000 86