关于这张照片
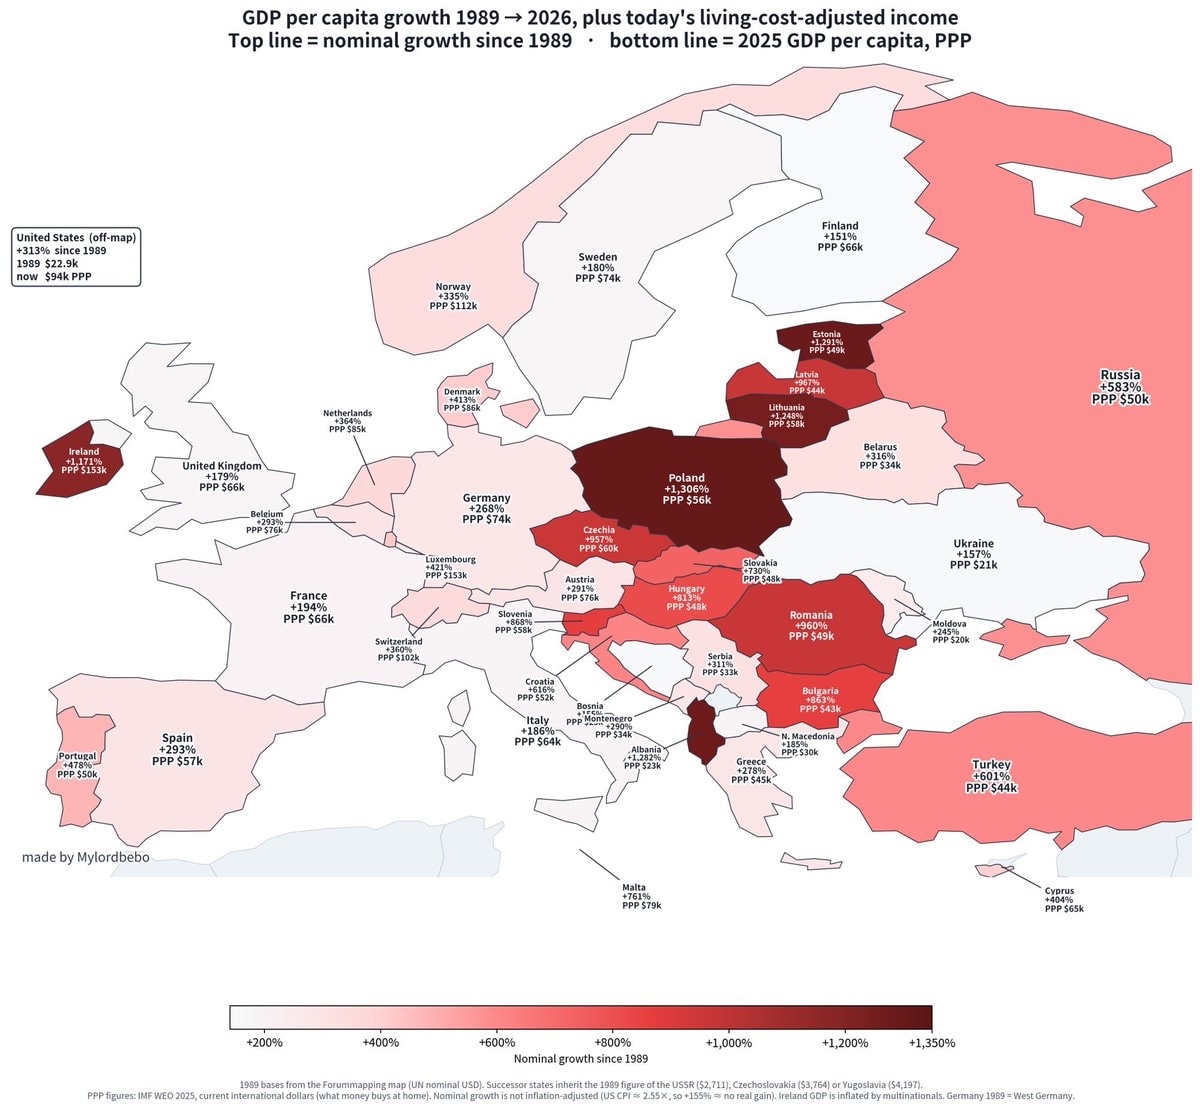
The image is a choropleth map of Europe showing GDP per capita growth from 1989 to 2026. Countries are colored based on their nominal growth since 1989, with darker shades indicating higher growth. Text overlays on each country display the percentage growth and the 2025 GDP per capita in PPP dollars. The mood is informative and data-driven, with a clear aesthetic focused on presenting economic statistics. A notable detail is the legend at the bottom, which explains the color scale and the basis of the data. ON-SCREEN TEXT: GDP per capita growth 1989 → 2026, plus today’s living-cost-adjusted income Top line = nominal growth since 1989 • bottom line = 2025 GDP per capita, PPP United States (off-map) +313% since 1989 1989 $22.9k now $94k PPP made by Mylordbebo +200% +400