iFANN
    搜索 iFANN...
    登录
    首页
    新闻
    视频
    书库
    图片
    GIF
    探索
    投票
    大奖
    iFAMOUS
    维基
    动漫
    聊天室
    通知
    私信
    收藏
    我的
    维基大奖iFAMOUS排行榜行业创作者奖励用户奖励条款隐私社区准则下架 / DMCA帮助开发者

    © 2026 iFANN

    首页
    搜索
    私信
    提醒
    我的
    照片
    Vertax
    Vertax@Xauusd_11mo
    🏢TradingView⭐Post Malone🏢Trump Media & Technology Group
    Gold

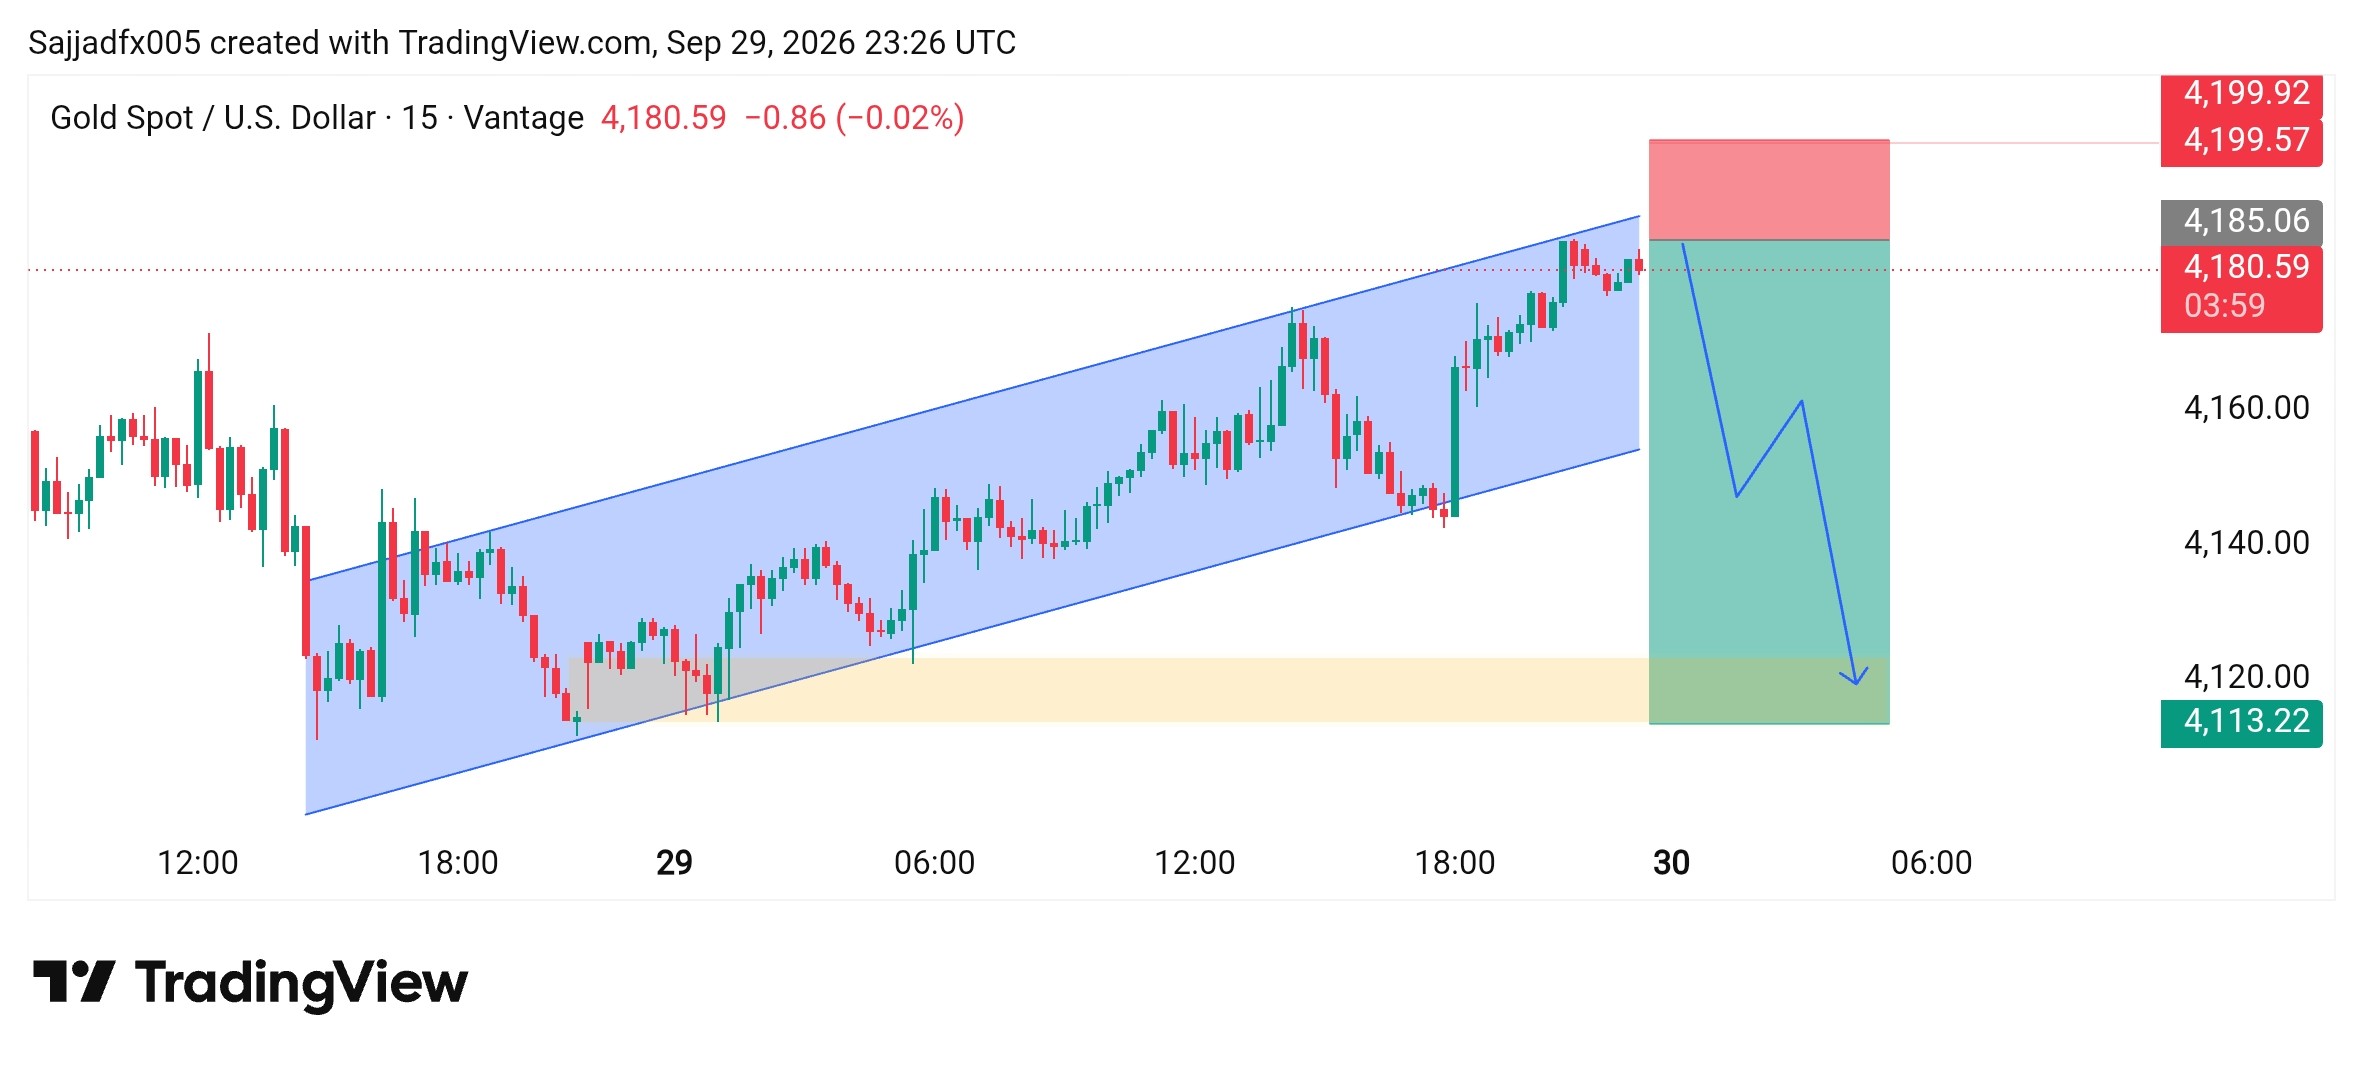
    @Xauusd_1#XAUUSD Sell limit Entry Zone 4186//4183 TP 4170 TP 4150 Join us on telegram daily free Trade updates https://t.me/vertex_analyticsfx

    查看原帖

    Gold

    @Xauusd_1 的照片· Sep 30, 2026· TradingView

    关于这张照片

    The image is a financial trading chart. It displays candlestick patterns representing the price movement of Gold Spot / U.S. Dollar over time. A blue channel highlights an upward trend, with a projected downward movement indicated by a blue line and shaded green and red zones. The style is technical and analytical. ON-SCREEN TEXT: Sajjadfx005 created with TradingView.com, Sep 29, 2026 23:26 UTC Gold Spot / U.S. Dollar · 15 · Vantage 4,180.59 -0.86 (-0.02%) 4,199.92 4,199.57 4,185.06 4,180.59 03:59 4,160.00 4,140.00 4,120.00 4,113.22 12:00 18:0

    查看TradingView的全部照片阅读TradingView维基

    ?

    还没有评论。来抢沙发吧!

    更多TradingView照片

    查看TradingView的全部照片
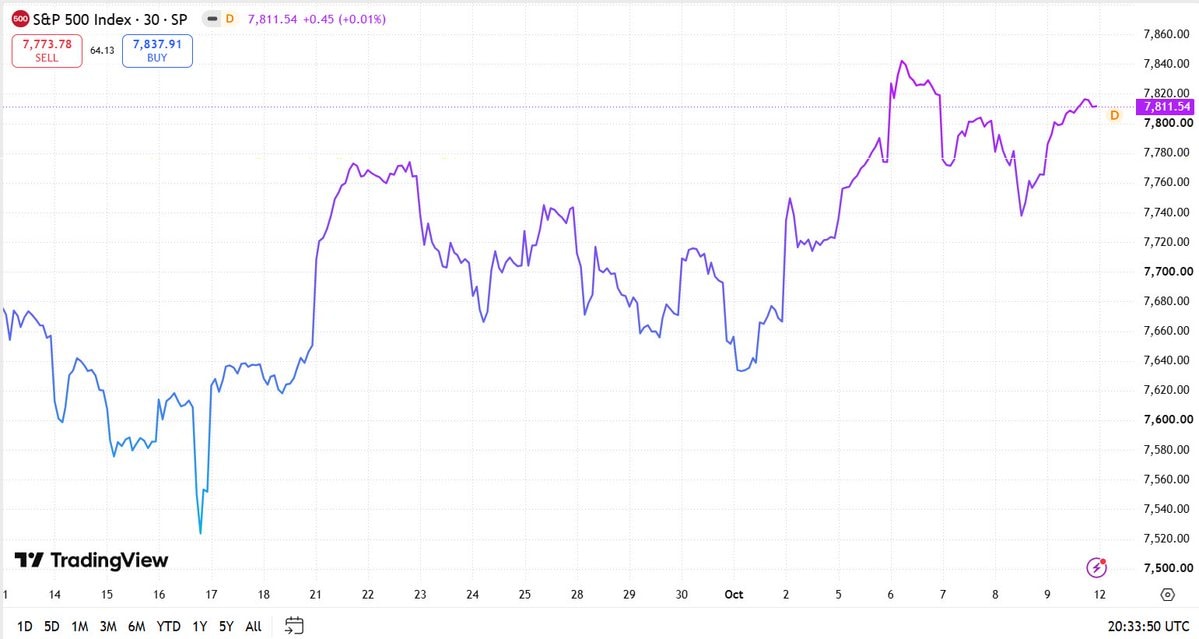
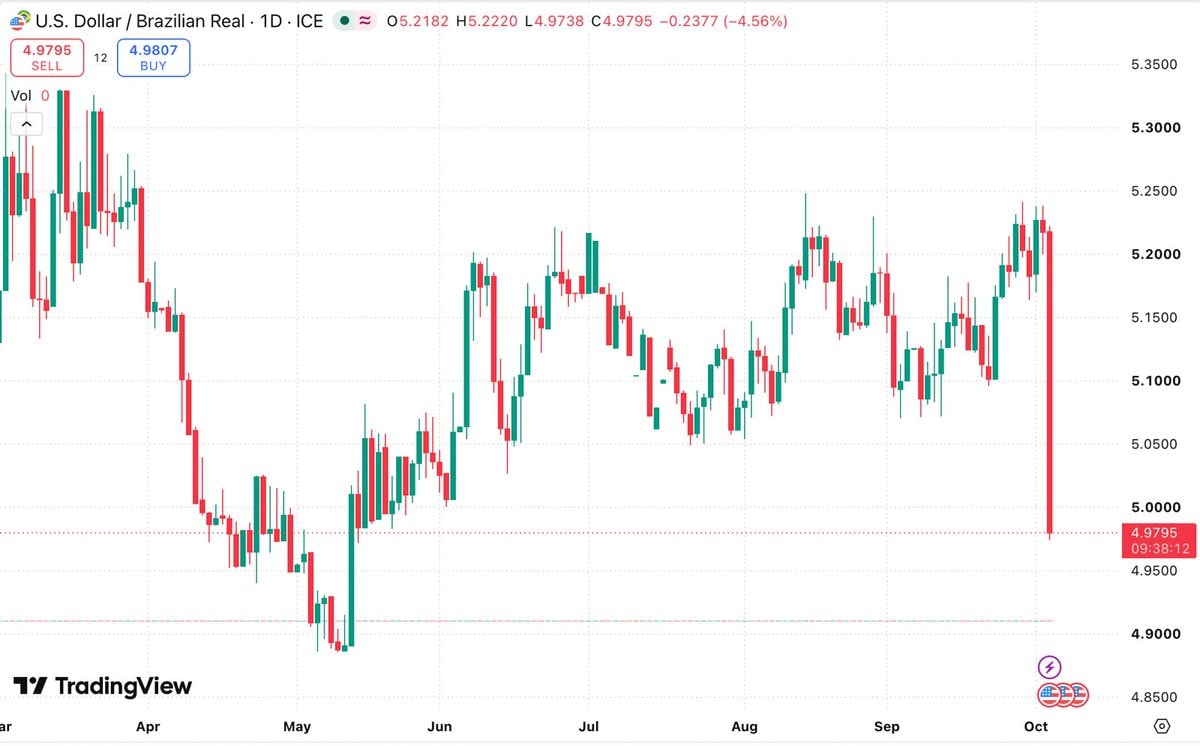
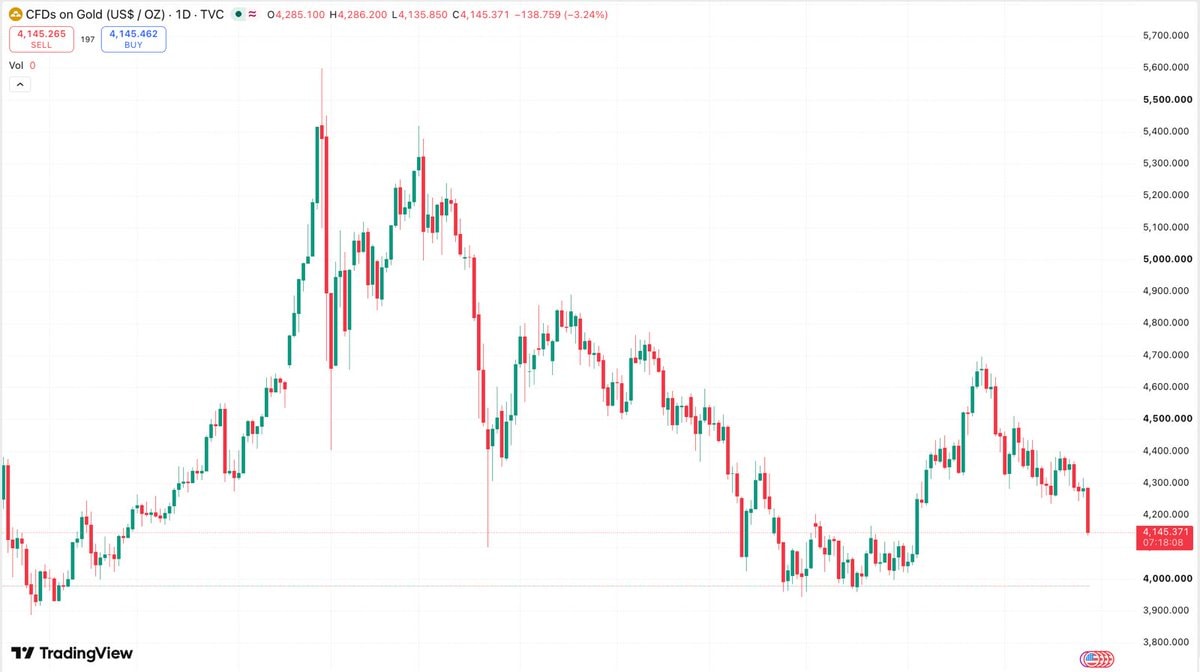
    Bitcoin and Ethereum market dropsBitcoin and Ethereum market dropsUS S&P 500 chart wipeoutUS S&P 500 chart wipeoutS&P 500 Index recovery analysisS&P 500 Index recovery analysisFlávio Bolsonaro Brazil election market reaction2Flávio Bolsonaro Brazil election market reactionGold Silver Market Drop Trading View2Gold Silver Market Drop Trading View
    照片
    Vertax
    Vertax@Xauusd_11mo
    🏢TradingView⭐Post Malone🏢Trump Media & Technology Group
    Gold

    @Xauusd_1#XAUUSD Sell limit Entry Zone 4186//4183 TP 4170 TP 4150 Join us on telegram daily free Trade updates https://t.me/vertex_analyticsfx

    查看原帖

    Gold

    @Xauusd_1 的照片· Sep 30, 2026· TradingView

    关于这张照片

    The image is a financial trading chart. It displays candlestick patterns representing the price movement of Gold Spot / U.S. Dollar over time. A blue channel highlights an upward trend, with a projected downward movement indicated by a blue line and shaded green and red zones. The style is technical and analytical. ON-SCREEN TEXT: Sajjadfx005 created with TradingView.com, Sep 29, 2026 23:26 UTC Gold Spot / U.S. Dollar · 15 · Vantage 4,180.59 -0.86 (-0.02%) 4,199.92 4,199.57 4,185.06 4,180.59 03:59 4,160.00 4,140.00 4,120.00 4,113.22 12:00 18:0

    查看TradingView的全部照片阅读TradingView维基

    ?

    还没有评论。来抢沙发吧!

    更多TradingView照片

    查看TradingView的全部照片
    Bitcoin and Ethereum market dropsBitcoin and Ethereum market dropsUS S&P 500 chart wipeoutUS S&P 500 chart wipeoutS&P 500 Index recovery analysisS&P 500 Index recovery analysisFlávio Bolsonaro Brazil election market reaction2Flávio Bolsonaro Brazil election market reactionGold Silver Market Drop Trading View2Gold Silver Market Drop Trading View